Aerial data collected using small unmanned aerial systems (sUAS) can be used directly to search for the visual cues of pest infestation on the plants. Direct searches on the images for the evidence of pest occurrence at multiple points in the field can be executed without prior experience and technical expertise. On the other hand, these data can be analyzed using remote sensing methods. However, such analysis to detect changes in plant reflectance spectra in response to pest infestation may require knowledge of pest biology and plant physiology as well as expertise on remote sensing methods.
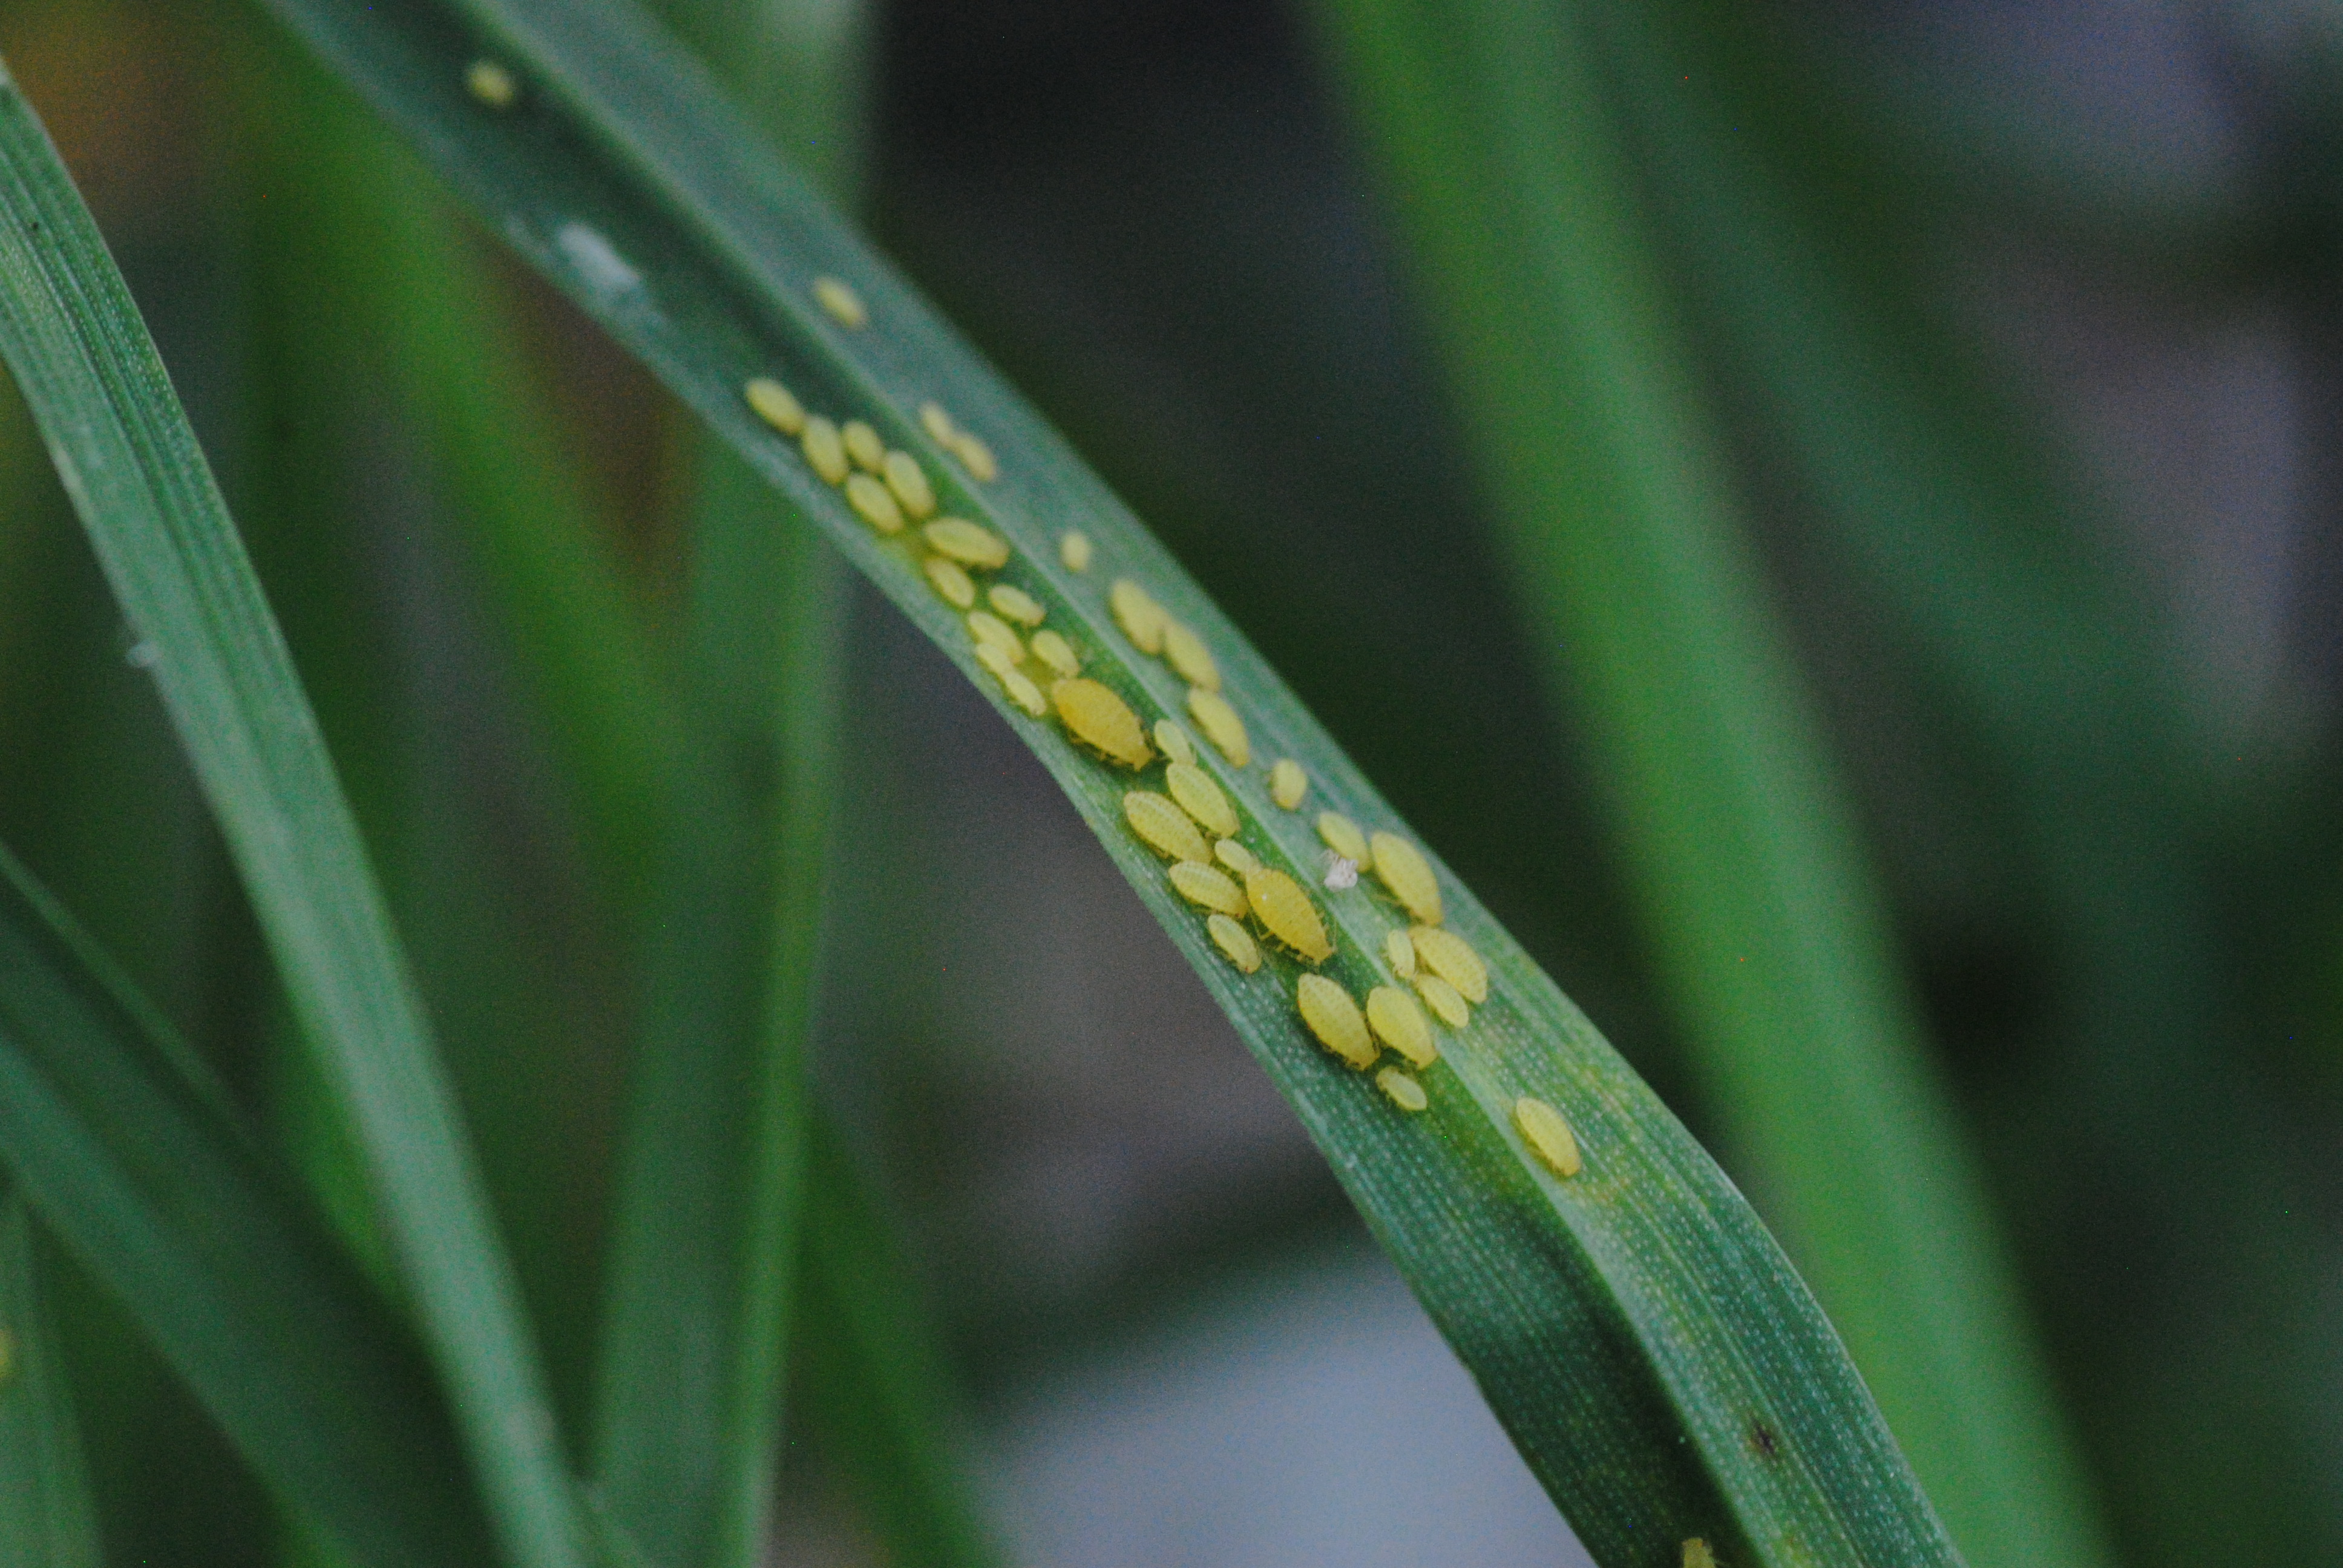
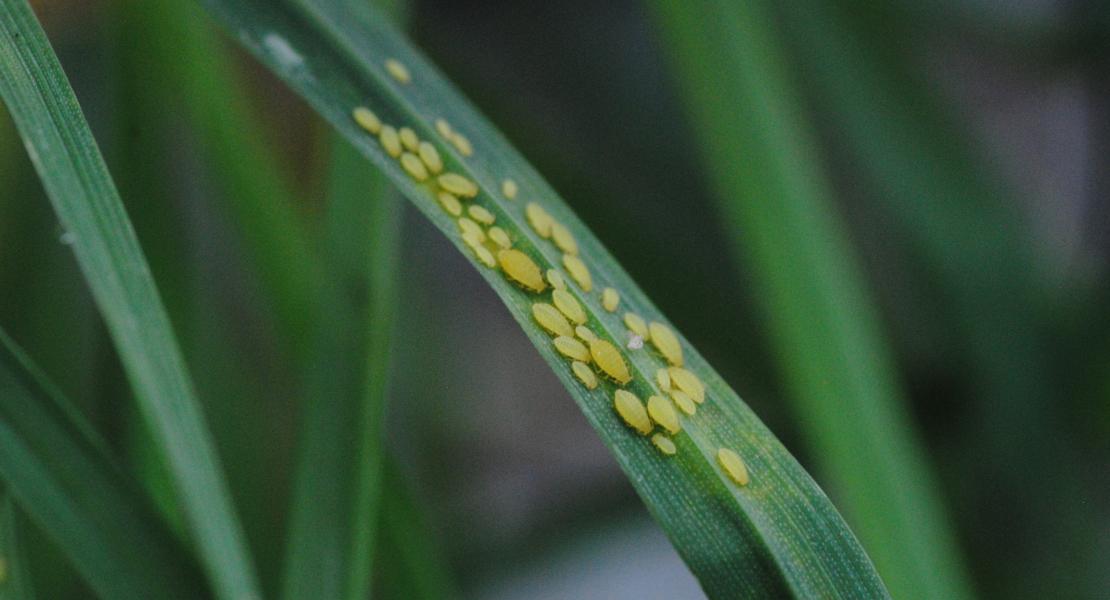
Aphid colonies on the upper part of leaves or stems may be visible on the photographs taken from a sUAV (Fig. 1). Several other indirect cues that indicate the presence of aphids on the plants might also be visible on the photographs. For example, various aphid species secret honeydew that accumulates on leaf surface and shine under natural light (Fig. 2). Several species of insects are attracted to honeydew secreted by aphids. Over time, sooty mold grows on honeydew giving the entire leaf surface darker color (Fig. 3). Finally, presence of aphid colonies can also be predicted based on the activity of predators (e.g, beetles, lacewings, flies, etc) on the plants (Fig. 4).
Small UAV such as Mavic Pro [LINK] that can fly very close to crop canopy (Fig. 5) and take photographs serve as an excellent tool for a quick survey of the agricultural field to examine pest infestation and plant performance. A series of photographs can be taken in a regular grid or at random by flying a UAV very close to the canopy (Fig. 6). UAV photographs that are often georeferenced can provide quick and reliable assessment of pest activity in the field.
Remote sensing data collected from UAVs are likely to revolutionize the survey and monitoring of insect pests in crop fields. Multi- and hyper-spectral sensors mounted on UAV can provide high-resolution data for the area of interest. These aerial data are processed and analyzed to identify the areas of poor plant performance that could be attributed to various abiotic (such as nutrient and water deficiency) and biotic (eg, pest infestation, diseases) stresses. For example, infestation by sucking insects often result in reduced chlorophyll concentration, reduced photosynthetic activity, and ultimately, reduced growth of the plants. Similarly, they may also result in lower moisture content of leaf tissues. These ecophysiological changes on leaf pigments, water content, and biomass accumulation can be assessed using various vegetation indices. Normalized difference vegetation index (NDVI) is one of the most common indices that provides valuable information about leaf pigment concentration, plant health, and biomass. NDVI uses canopy reflectance in the near infra-red (NIR) region (reflected by the leaf mesophyll tissue) and red region (absorbed by photosynthetic pigments) of the spectrum. Several other indices specific to various leaf pigments (eg., chlorophyll index, crop chlorophyll index, carotenoid reflectance index, anthocyanin reflectance index, etc.), nutrient (primarily, N), water content (water band index) and vegetation properties (NDVI, enhanced vegetation index) have been proposed (see Thenkabail et al. 2012). Spatial and temporal variation on these indices within a field can be associated with various plant stresses. However, vegetation indices derived from UAV platforms are yet to be applied in pest management in the agricultural systems.
Several studies that examined pest infested and not infested plants provide evidence of consistently lower NDVI values for the infested plants (Fig. 7). For example, wheat plants infested by greenbugs and Russian wheat aphids showed significantly lower NDVI than the control plants (Yang et al. 2005, 2009, Mirik et al. 2006, 2007, 2012, Elliott et al 2007, Yuan et al. 2014). Similar trends are shown for aphid and/or mite infested cotton (Reisig and Godfrey 2006, 2007, 2010) and soybean plants (Alvis et al. 2015). Indices specific to aphid infestation [namely, damage sensitive spectral indices (DSSI I and II) and aphid indices (Mirik et al. 2006, 2007)] also differed significantly between infested and control plants.
UAVs serve as an excellent aerial platform to collect high resolution, both spatial and temporal, reflectance data in agricultural areas. Recent advances in a wide range of sensors, such as multispectral, hyperspectral, LiDAR etc [LINK], offer the opportunity to evaluate plant ecophysiological responses and productivity at large spatial and temporal scales. Accounting for the influence of various topographic and edaphic factors on such spatio-temporal variations on spectral data may reveal the contribution of biotic (e.g, insect pests and diseases) factors on those variations.
Alvis, T. M., I. V. Macrae, and R. L. Koch. 2015. Soybean aphid (Hemiptera: Aphididae) affects soybean spectral reflectance. Journal of Economic Entomology 108: 2655–2664
Elliott, N., M. Mirik, Z. Yang, T. Dvorak, M. Rao, J. Michels, T. Walker, V. Catana, M. Phoofolo, K. Giles, and T. Royer. 2007. Airborne multi-spectral remote sensing of Russian wheat aphid injury to wheat. Southwestern Entomology 32(4):213-219
Mirik, M. R. J. Ansley, G. J. Michels Jr., and N. C. Elliott. 2012. Spectral vegetation indices selected for quantifying Russian wheat aphid (Diuraphis noxia) feeding damage in wheat (Triticum aestivum L.). Precision Agriculture 13: 501-516
Mirik, M., G. J. Michels, S. Kassymzhanova-Mirik, and N. C. Elliott. 2007. Reflectance characteristics of Russian wheat aphid (Hemiptera: Aphididae) stress and abundance in winter wheat. Computer and Electronics in Agriculture 57: 123-134
Mirik, M., G. J. Michels, S. Kassymzhanova-Mirik, N. C. Elliott, V. Catana, D. B. Jones, and R. Bowling. 2006. Using digital image analysis and spectral reflectance data to quantify damage by greenbug (Hemiptera: Aphididae) in winter wheat. Computers and Electronics in Agriculture 51: 86-98
Reisig, D. D., and L. D. Godfrey. 2006. Remote sensing for detection of cotton aphid - (Homoptera: Aphididae) and spider mite - (Acari: Tetranychidae) infested cotton in the San Joaquin Valley. Environmental Entomology 39: 1255-1263
Reisig, D. D., and L. D. Godfrey. 2007. Spectral response of cotton aphid - (Hemoptera: Aphididae) and spider mite – (Acari: Tetranychidae) infested cotton: controlled studies. Environmental Entomology 36: 1466-1474
Reisig, D. D., and L. D. Godfrey. 2010. Remotely sensing arthropod and nutrient stressed plants: a case study with nitrogen and cotton aphid - (Hemiptera: Aphididae). Environmental Entomology 39: 1255-1263
Thenkabail, P. S., J. G. Lyon, and A. Huete. 2012. Hyperspectral remote sensing of vegetation. CRC Press, Boca Raton, FL.
Thenkabail, P.S., J. G. Lyon, and A. Huete. 2012. Advances in hyperspectral remote sensing of vegetation and agricultural croplands. Pages 3-35 in P. S. Thenkabail, J. G. Lyon, and A. Huete, editors. Hyperspectral Remote Sensing of Vegetation. CRC press, Boca Raton, Florida.
Yang, Z, M. N. Rao, N. C. Elliott, S. D. Kindler, and T. W. Popham. 2005. Using ground-based multispectral radiometry to detect stress in wheat caused by greenbug (Homoptera: Aphididae) infestation. Computers and Electronics in Agriculture 47: 121-135
Yang, Z, M. N. Rao, N. C. Elliott, S. D. Kindler, and T. W. Popham. 2009. Differentiating stress induced by greenbugs and Russian wheat aphids in wheat using remote sensing. Computers and Electronics in Agriculture 67: 64-70
Yuan, L., Y. Huang, R. W. Loraamm, C. Nie, J. Wang, and J. Zhang. 2014. Spectral analysis of winter wheat leaves for detection and differentiation of diseases and insects. Field Crops Research 156: 199-207
- Log in to post comments